By By Morgan Flood, Policy Research Specialist
Access to a traditional bank account is an important, though often less-considered, intersecting issue with food insecurity and poverty. Lack of a checking or savings account may push people towards the use of alternative financial services, such check-cashing services and money orders, which often have fees of between 2% and 5% per transaction, cutting into already tightly stretched budgets. Other alternative financial services, like payday loans, often have predatory payback structures, interest rates, and fees which may trap low income individuals in debt spirals that are extremely difficult to escape. Overall, the average American without access to mainstream financial services spent more than $1,000 per year in interest and fees for alternative services as of 2018. In this policy blog, CPFB Impact and Policy Research assesses access to the financial system among central Pennsylvania food pantry visitors.
According to the Federal Deposit Insurance Corporation (FDIC), as of 2023, 3.0% of Pennsylvanian households were unbanked, meaning that they wholly lacked a checking, savings, or money market account, and another 11.3% were underbanked, meaning that they had an account but had also used an alternative financial service within the last year. Although the FDIC's findings for Pennsylvania were not fully disaggregated by race and ethnicity, rates of being unbanked or underbanked were lower among non-Hispanic white households at 1.7% and 9.2% respectively, implying that Pennsylvanians of color were disproportionately likely to have limited or no access to a bank account.
National data supports this hypothesis, as 10.6% of Black and 9.5% of Hispanic households were unbanked in 2023, compared to just 1.9% of non-Hispanic white and 4.2% of all households. Disparities in underbanking by race and ethnicity were large as well. Almost a quarter (23.8%) of Black and about a fifth (21.7%) of Hispanic households were underbanked compared to a tenth of (10.1%) non-Hispanic white and less than a sixth of (14.2%) all households.
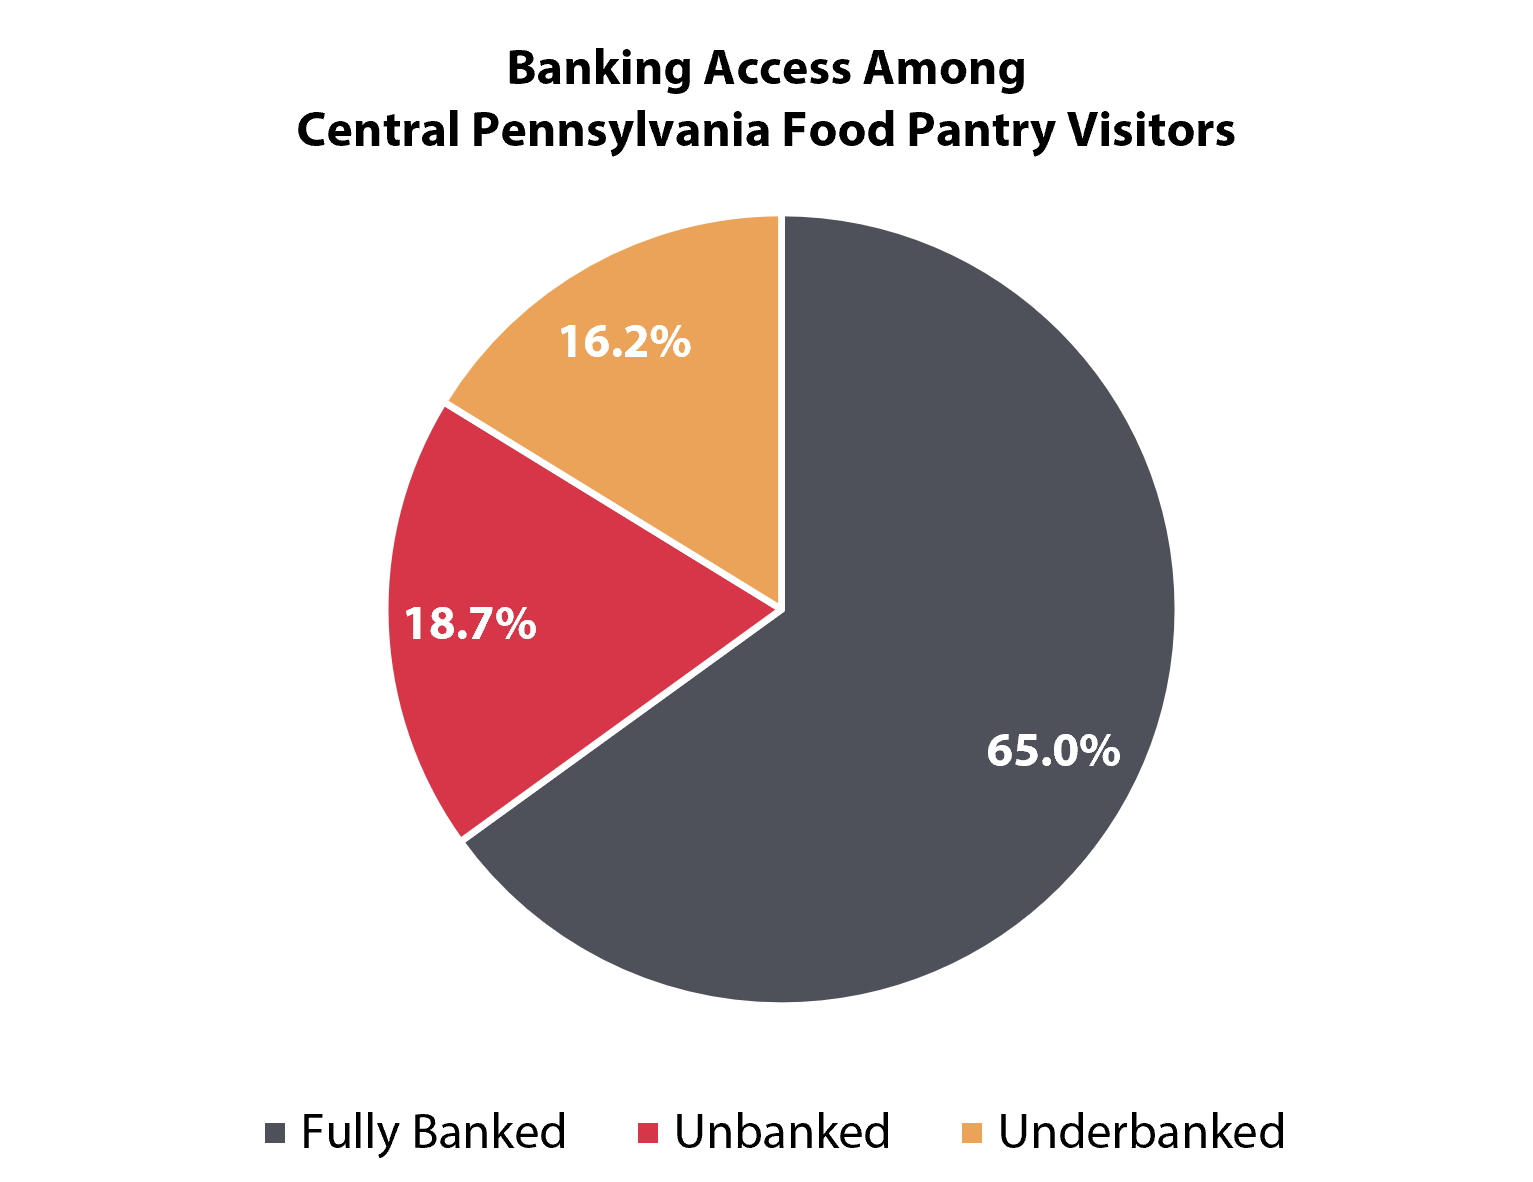
As shown in the chart at left, results from more than 3,100 surveys conducted at food pantries across central Pennsylvania show that nearly one in five food pantry visitors households (17.0%) in the region was unbanked, and another one in seven (14.7%) was underbanked. In total, about three in ten households served by the charitable food network had limited or no access to the mainstream financial system. Food pantry visitors were therefore more than five times as likely as the average Pennsylvanian to have no bank account and were 27% more likely to have used an alternative financial service in the previous twelve months even if they did have a bank account.
As observed in the national data, there were clear disparities in financial access by race and ethnicity among central Pennsylvania pantry visitors. Two in five Hispanic (37.3%) and one in four Black (25.2%) pantry visitor households were unbanked, while the same was true of just one in nine non-Hispanic white households (11.9%). Trends were different for underbanking rates among pantry visitors, with 23.8% of Black households, 13.3% of Hispanic households, and 15.7% of non-Hispanic white households with bank accounts having nevertheless used an alternative financial service in the last year.
Overall, these findings show that a substantial proportion of food pantry visitors are disconnected from the mainstream financial system and that this is especially likely to be true of Hispanic and Black pantry visitors. Pantries and other stakeholders who are interested in helping connect unbanked and underbanked neighbors to traditional financial services could consider partnering with local banks, credit unions, and nonprofits to do so, with emphasis on increasing awareness of and access to services that work well for low-income households (i.e. checking accounts with no minimum balance requirements and low overdraft fees). "Bankable moments," most notably tax season, are major opportunities to provide education and resources that can help more neighbors safely save and spend their money in affordable, accessible ways.
Data Sources and Methods:
The key data collection tool used as part of CPFB IPR's flagship Community Hunger Mapping research initiative is the Feeding America Client Survey (FACS), a survey conducted at food pantries that asks visitors about their experiences with charitable food, demographics, and personal circumstances, including their food security status and housing situation. Since surveying began in fall 2022, 3,745 households served at more than 70 agencies across sixteen counties have responded to the survey. Adams, Bradford, Centre, Clinton, Cumberland, Dauphin, Franklin, Lancaster, Lebanon, Lycoming, Northumberland, Potter, Snyder, Sullivan, Tioga, and Union counties are the sixteen represented counties; they are geographically diverse and together make up more than two thirds (68.7%) of the total population of CPFB's service area, so the aggregate data can be assumed to be generally representative of food pantry visitors across central Pennsylvania. For the purposes of this policy blog, "don't know or prefer not to answer" results, as well as blank responses to the financial access questions were excluded, bringing the total number of included results down to 3,197.