Policy Memo:
Food Price Inflation as of November 2022
On Tuesday, December 13, the United States Department of Labor’s Bureau of Labor Statistics (BLS) released the November 2022 Consumer Price Index, or CPI, which is a measure of change in the prices of common goods and services purchased by American consumers, such as food, energy, consumer goods and services, housing, medical care, and transportation. The CPI is one of the primary measures of inflation in the United States.
Main Takeaways
- Annualized overall inflation rates for all goods and services are still quite high, at 7.1%, but the rate of growth has slowed down to 0.1% in the last month with seasonal adjustment and actually declined slightly (-0.1%) without seasonal adjustment.
- Food price inflation remains higher than total inflation; over the last year, the cost of food overall has risen 10.6%. Grocery cost has risen 12.0%.
- The cost of all food increased 0.5% in November with seasonal adjustment, as did the cost of food at home, or groceries, specifically.
- Unadjusted increases for all food and for groceries were 0.2% and 0% respectively.
- Grocery categories with especially high price increases were cereals and bakery and dairy and related products, which have both risen 16.4% since last November.
- Eggs have increased in price nearly 50% since November 2021, likely due to the impact the avian flu has had on egg producers.
Implications for the Charitable Food System
- Although the rate at which costs are increasing has slowed compared to earlier in 2022, overall inflation is still higher than it has been since the early 1980s.
- This highly inflationary environment has likely played a major role in the significant increased demand for charitable food services over the last year, as households are unable to meet increasing costs for their basic needs, including housing, transportation, medical care, and food.
- Inflation remains a multifaceted challenge for the charitable food network, especially during the holiday season, as food banks and their partner agencies have to contend with both increased need for food and higher purchasing costs.
- Increased costs can put stress on agency food budgets and inventories and may lead to programs straining to serve more households with less product than in the past.
- This issue may be particularly pronounced during the holidays, as demand generally goes up seasonally independent of inflation.
- Interest rate hikes by the Federal Reserve appear to be beginning to bring inflation under control, which is good news in terms of purchasing costs for the charitable food network and for individuals.
- However, these rate increases may create a tightening of the job market or even a recession in the future. If this comes to pass, it will induce additional need for charitable food as individuals lose hours at work or face layoffs.
- The expected end of SNAP emergency allotments in February 2023 may put even further strain on both the charitable food network and the households it serves, as food costs will probably remain elevated, but households will lose a key support.
Annual Inflation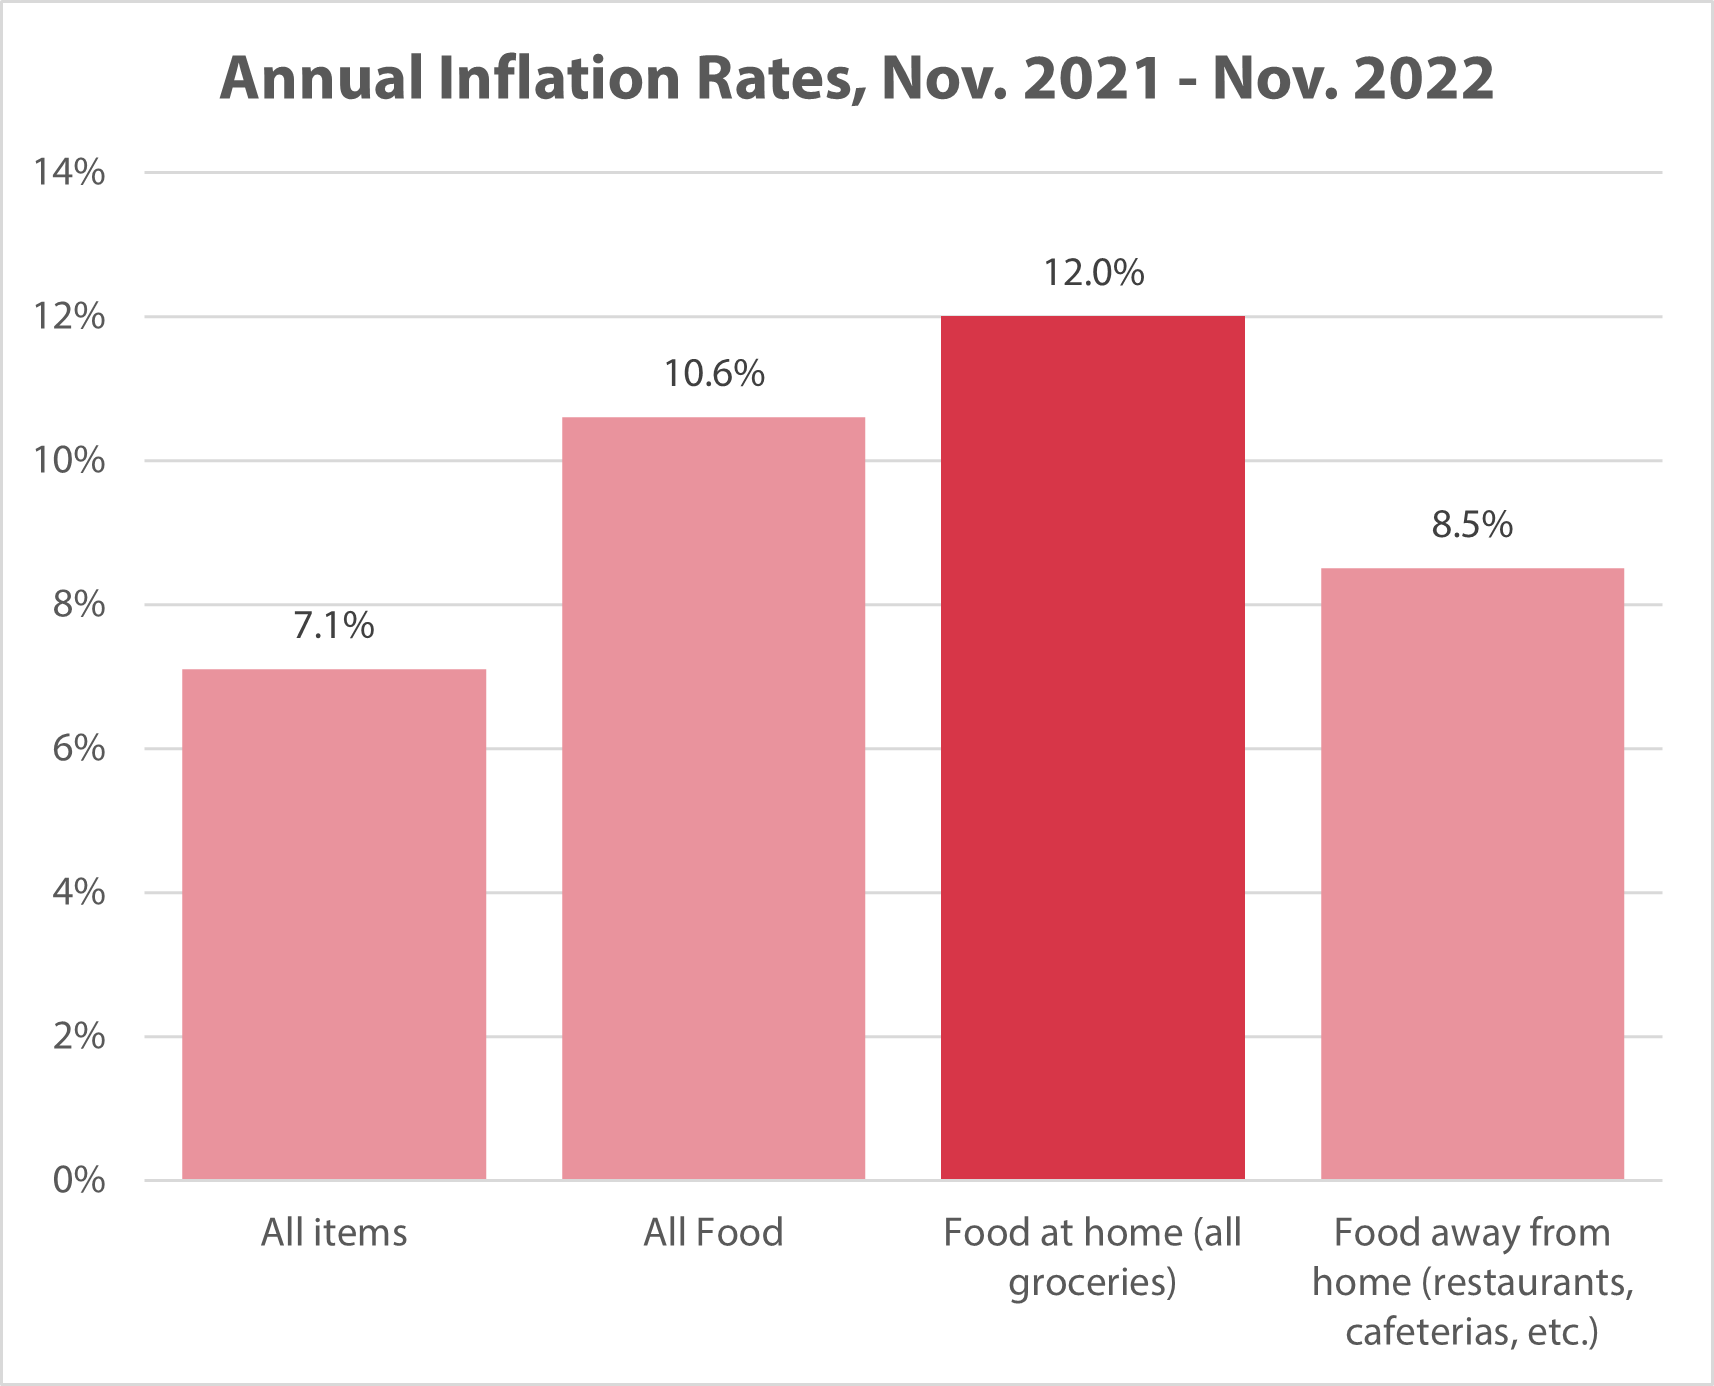
Overall inflation (CPI-U) was up 0.1 percent in November 2022 with seasonal adjustment, and total inflation has been 7.1% for all items since November 2021.
However, inflation rates vary by product segment; after seasonal adjustment, prices for food grew at 0.5 percent this month, or about five times faster than the aggregated seasonally adjusted general inflation rate. Without seasonal adjustment, grocery prices remained flat in November 2022.
Over the last year, prices for food have increased faster than those for other items; the cost of all food has gone up 10.6% since last November. Food at home, or groceries, appears to have been the primary driver of inflation in the broader food segment as the increase in that category is 12.0%, compared with only 8.5% for food away from home, which includes restaurant meals, cafeterias, and other similar vendors.
Annual and Monthly Food Inflation by CPI Product Category
Annual and monthly inflation in food costs by category is shown in the table below. Both unadjusted and seasonally adjusted figures have been included for additional context.
Of particular note are high seasonally adjusted increases in cereal and bakery (1.1%), fruits and vegetables (1.4%) and dairy and related products (1.0%); these categories also have some of the highest overall annual increases in price at 16.4%, 9.7%, and 16.4% respectively.
| CPI category | Unadjusted Annual Percent Increase, Nov. 2021 – Nov. 2022 |
Unadjusted Monthly Percent Increase, Oct. 2022 – Nov. 2022 |
Seasonally Adjusted Monthly Percent Increase, Oct. 2022 – Nov.2022 |
| Food at home | 12.0% | 0.0% | 0.5% |
| Cereals and bakery products | 16.4% | 0.8% | 1.1% |
| Meats, poultry, fish, and eggs | 6.8% | -0.6% | -0.2% |
| Dairy and related products | 16.4% | 0.7% | 1.0% |
| Fruits and vegetables | 9.7% | 0.4% | 1.4% |
| Nonalcoholic beverages | 13.2% | -0.3% | 0.7% |
| Other food at home | 13.9% | -0.5% | -0.1% |
| Food away from home | 8.5% | 0.5% | 0.5% |
| All Food | 10.6% | 0.2% | 0.5% |
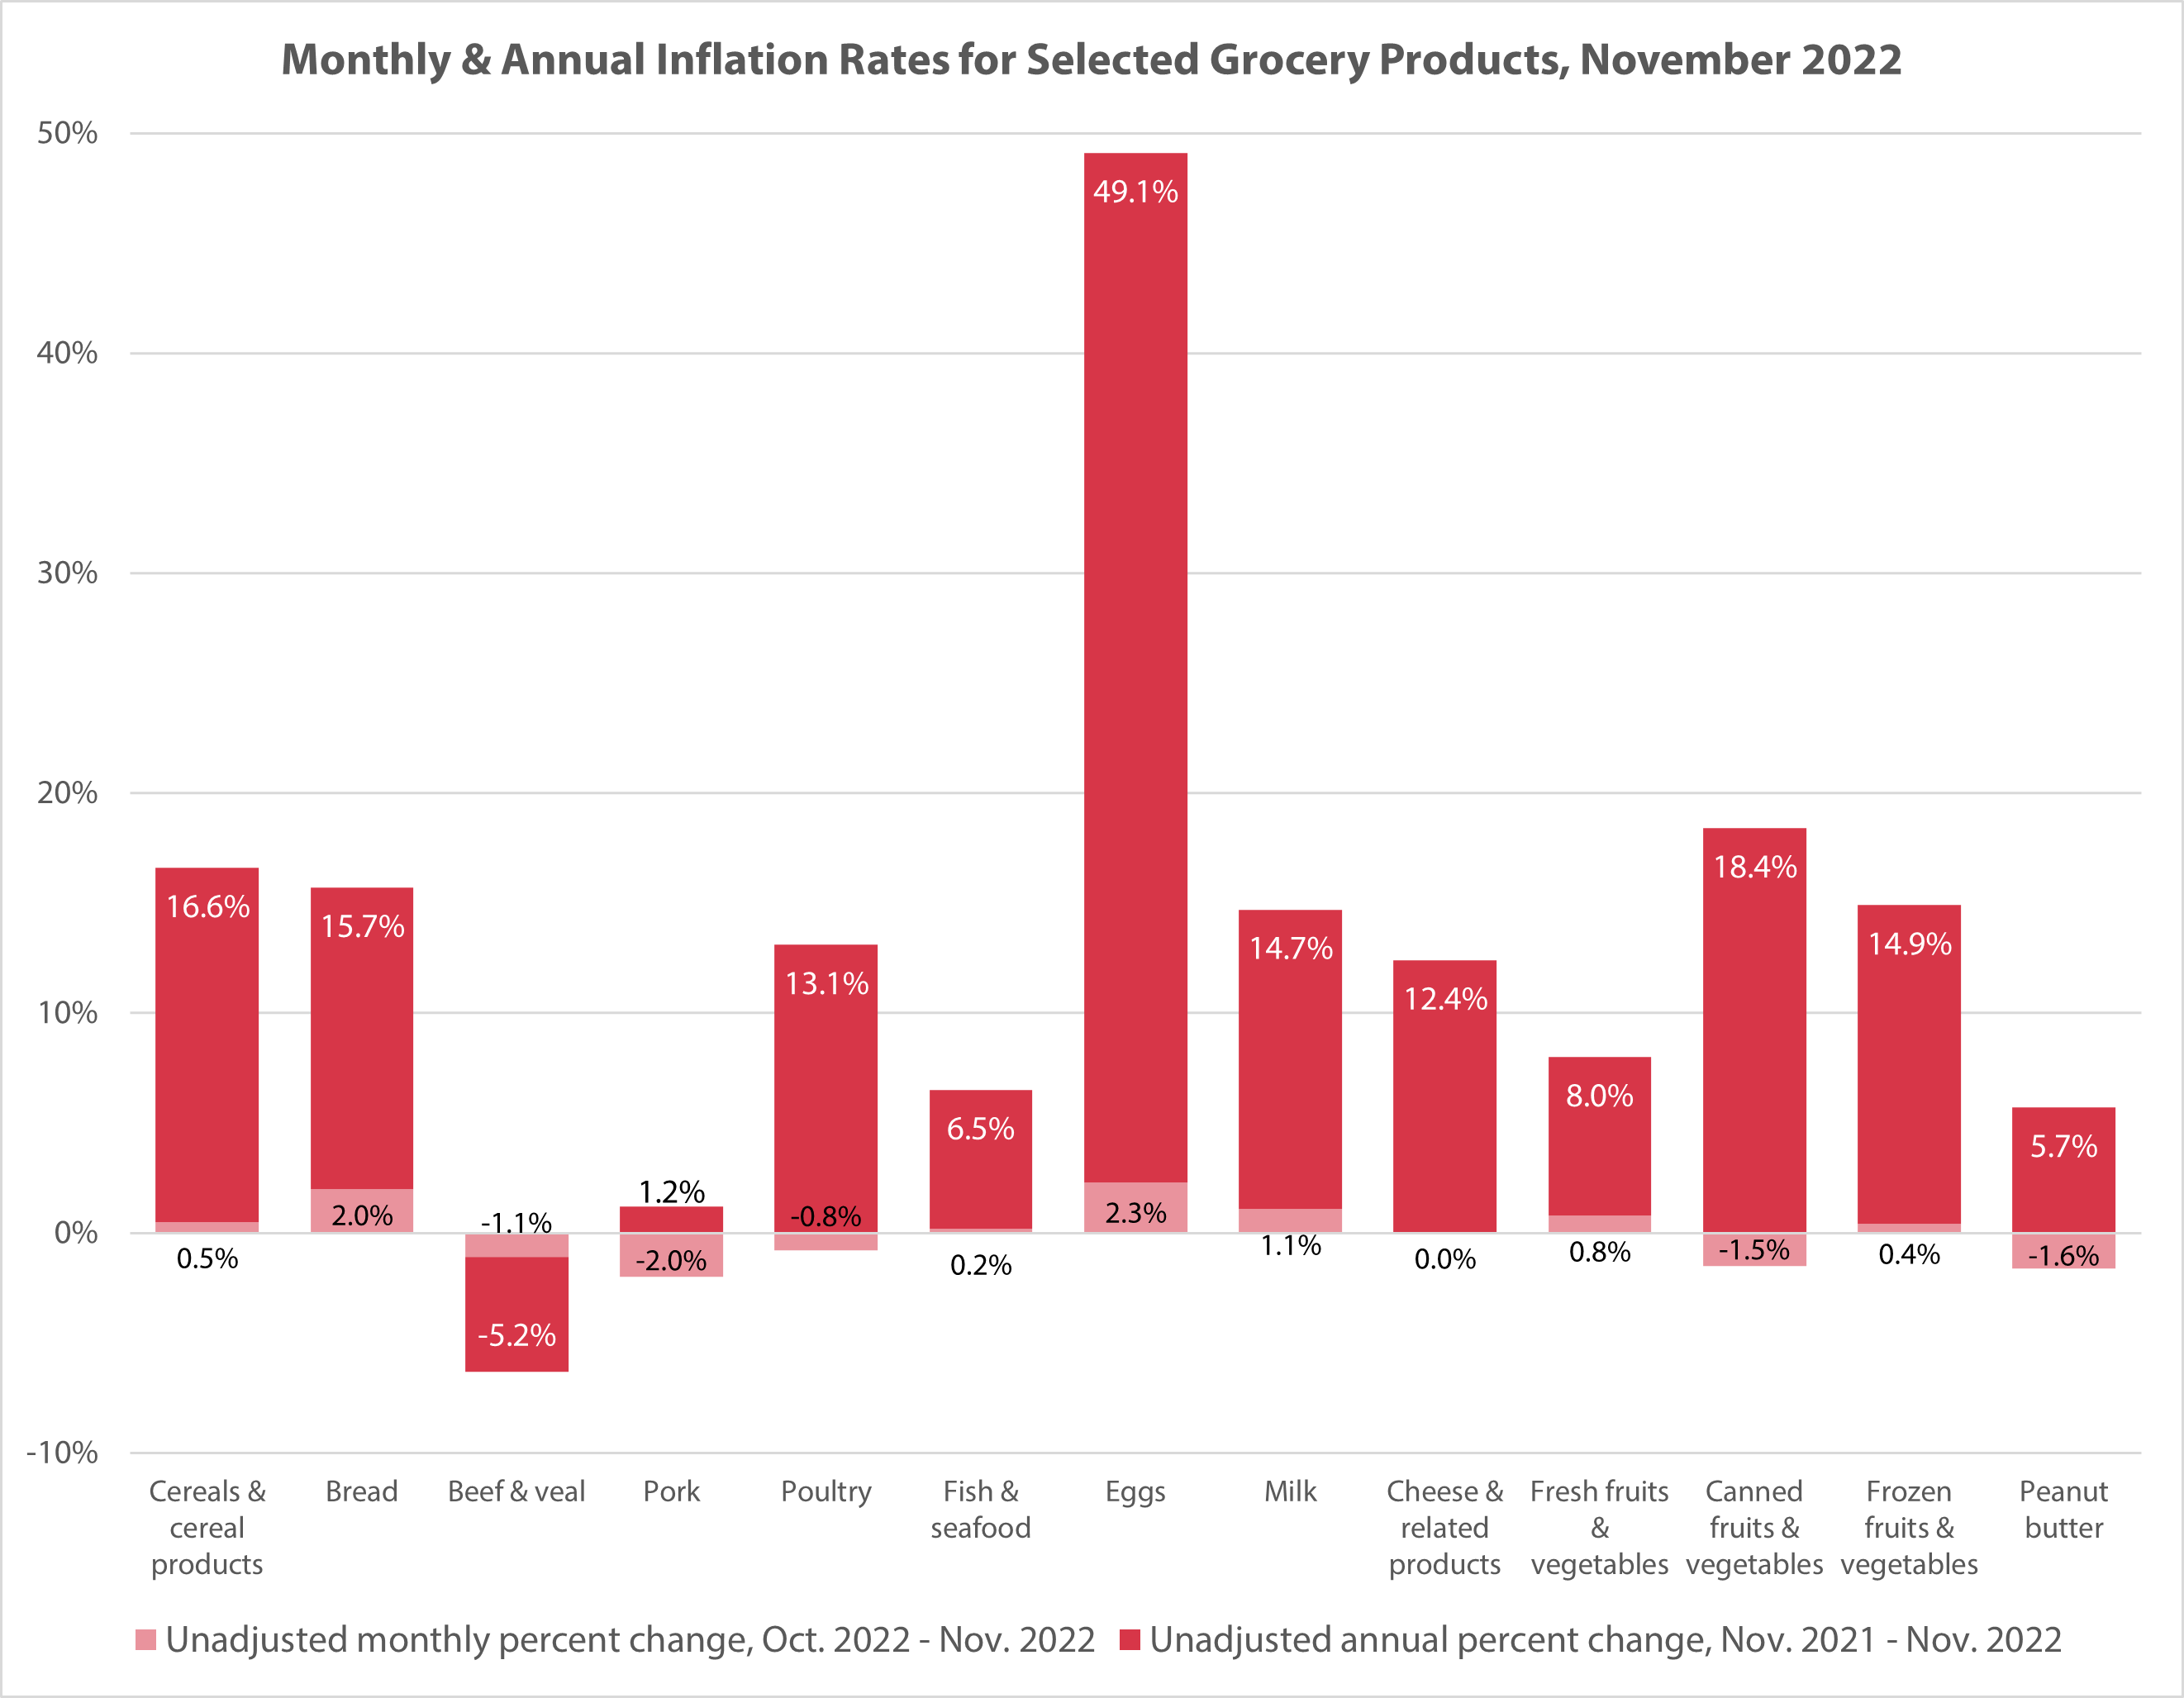
Annual and Monthly Food Inflation for Selected Grocery Product Categories
Within the broader grocery category, different product types saw different price changes, both in the last year and in November 2022. All rates discussed below are not seasonally adjusted.
Eggs in particular have skyrocketed in price; the cost has gone up nearly 50% since November 2021, and if November 2022’s 2.3% rate of increase were to be sustained for a full year, it would equate to an additional 25%. As mentioned above, this increase is likely driven by the ongoing impact of avian flu on egg producers; chicken prices have also risen (12% in the last year), but due to differences in the supply chain and production process, meat has not been as strongly impacted by the flu.
Other products that have increased in price more than the overall food at home rate of 12.0% in the last year include cereals and cereal products (16.6%), bread (15.7%), poultry (13.1%), milk (14.7%), cheese and related products (12.4%), canned fruit and vegetables (18.4%), and frozen fruit and vegetables (14.9%).
Annual and monthly inflation rates for selected product categories relevant to the CPFB’s food sourcing are shown in the chart below.