This report examines 2021 food insecurity rates in the 27 counties served by the Central Pennsylvania Food Bank (CPFB) and how these rates have changed since 2020 using newly released Feeding America Map the Meal Gap food insecurity estimates. This report is best seen as a backwards-looking examination of food insecurity in the CPFB’s service territory in 2021; the data and conclusions written below are not reflective of the current food insecurity situation as of July 2023.
Food insecurity in CPFB counties dropped overall in 2021; this is likely due to the presence of multiple large and innovative government investments made in response to the COVID-19 pandemic. However, these supports are no longer available to households in 2023.
Without key government investments such as the SNAP emergency allotments and the expanded Child Tax Credit, food insecurity rates in 2023 are likely more similar to those of 2020, with 2021 best seen as a temporary drop and a demonstration of the potentially massive impact public policy decisions can have on food insecurity.

Figure 1. Food insecurity rates and the number of food insecure children/persons between 2019 and 2021 for counties served by the Central PA Food Bank. Data is from the Feeding America Map the Meal Gap model.
The fall in food insecurity and poverty in 2021 demonstrates the ability of the United States to lower food insecurity rates through strong public policy and programmatic responses. This further indicates that public policy actions are critical to making significant strides toward the Feeding America goal of a 5% food insecurity rate.
Unfortunately, the expiration of major governmental programs available in 2021 means that food insecurity rates in 2023 have spiked again. The CPFB and its partner agencies have seen a large rise in demand for charitable food assistance amidst cumulatively high inflation and the expiration of most pandemic supports like the expanded Child Tax Credit and SNAP emergency allotments. This increase is likely a leading indicator that there has been a recent rise in food insecurity and is corroborated by both recent U.S. Census Bureau Household Pulse Surveys and the CPFB’s own internal operations metrics; in FY2023, CPFB is moving only slightly less food to its neighbors in need than it was in FY2021 at the beginning of the pandemic.
Food insecurity rates across the CPFB’s service territory dropped from 9.8% in 2020 to 8.7% in 2021. The number of food insecure people correspondingly dropped by 30,630 in 2021, from 298,120 to 267,490. This is a decrease of food insecurity of nearly 10% in just one year.
The below maps show the general food insecurity rate by county from 2020 to 2021.
Overall Food Insecurity Rate
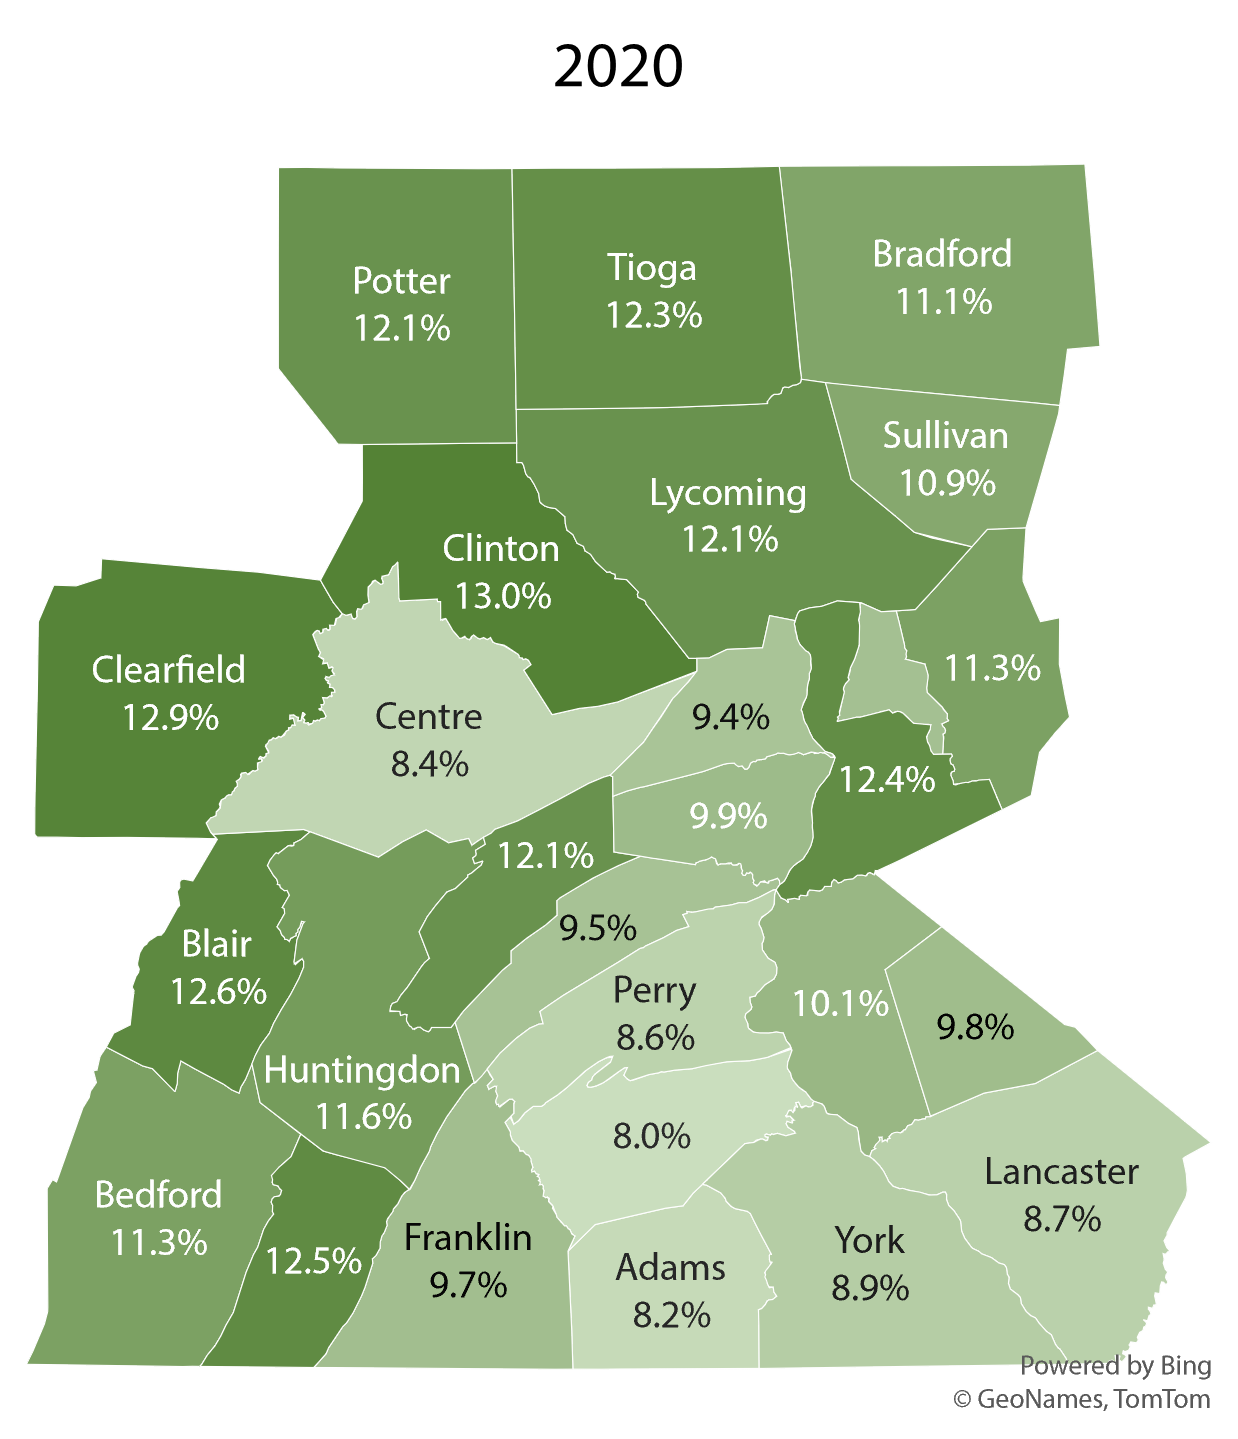
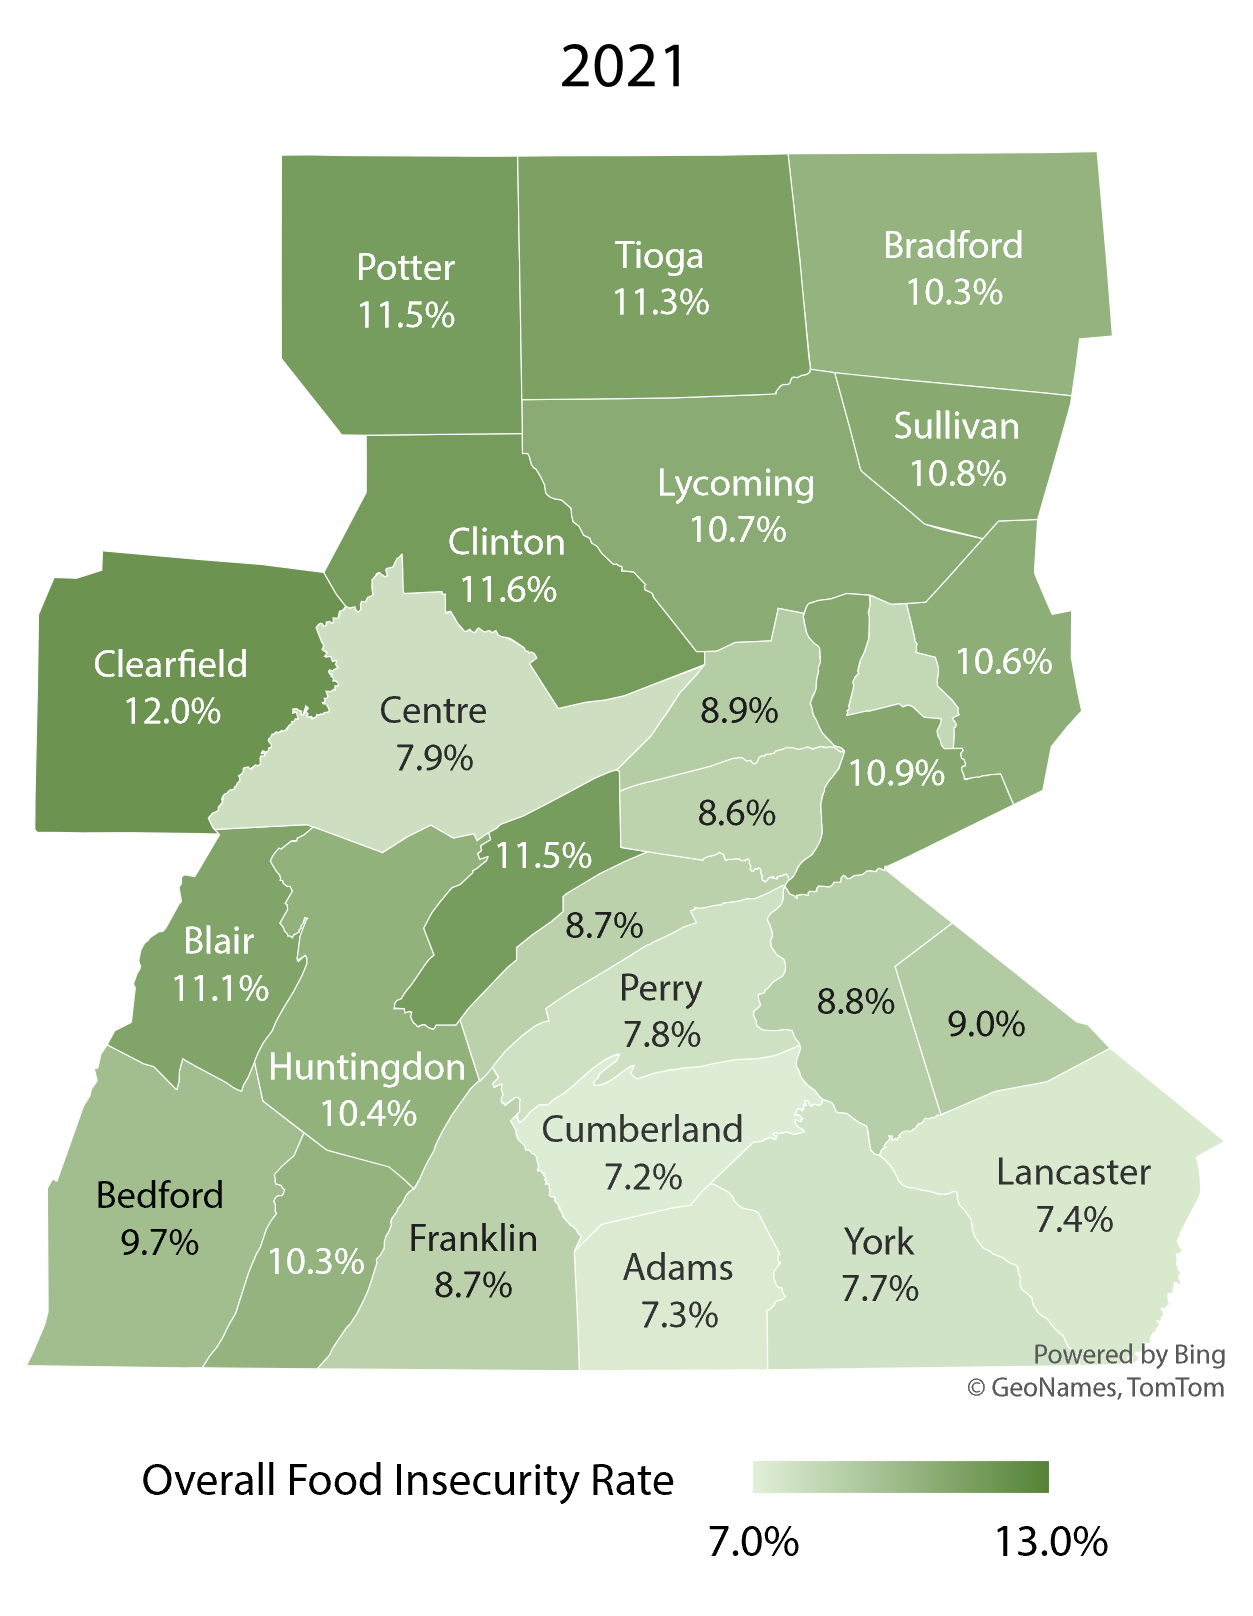
- Every CPFB county saw a decrease in food insecurity. Fulton, Lancaster, and Bedford counties saw the largest drop in food insecurity, with decreases of 17.6%, 14.9%, and 14.2%, respectively.
- The decrease in food insecurity rates in CPFB counties was driven by a drop in child food insecurity. Adult food insecurity dropped by about 4%, while child food insecurity dropped by 25%. There were 9,210 fewer food insecure adults in 2021 than 2020 and 22,130 fewer food insecure children.
- Rural counties in the northern and western parts of the CPFB’s service territory continue to have the highest food insecurity rates. The southern CPFB counties on average saw a larger decrease in food insecurity rates than the northern CPFB counties. This is in part due to the larger populations of children present in these counties, since the expanded Child Tax Credit was a key driver of the drop in food insecurity among households with children.
- According to the S. Census Bureau’s Household Pulse Survey, the current 2023 food insecurity landscape looks more like 2020 than 2021,[1] further demonstrating the impact expansive government policy can have.
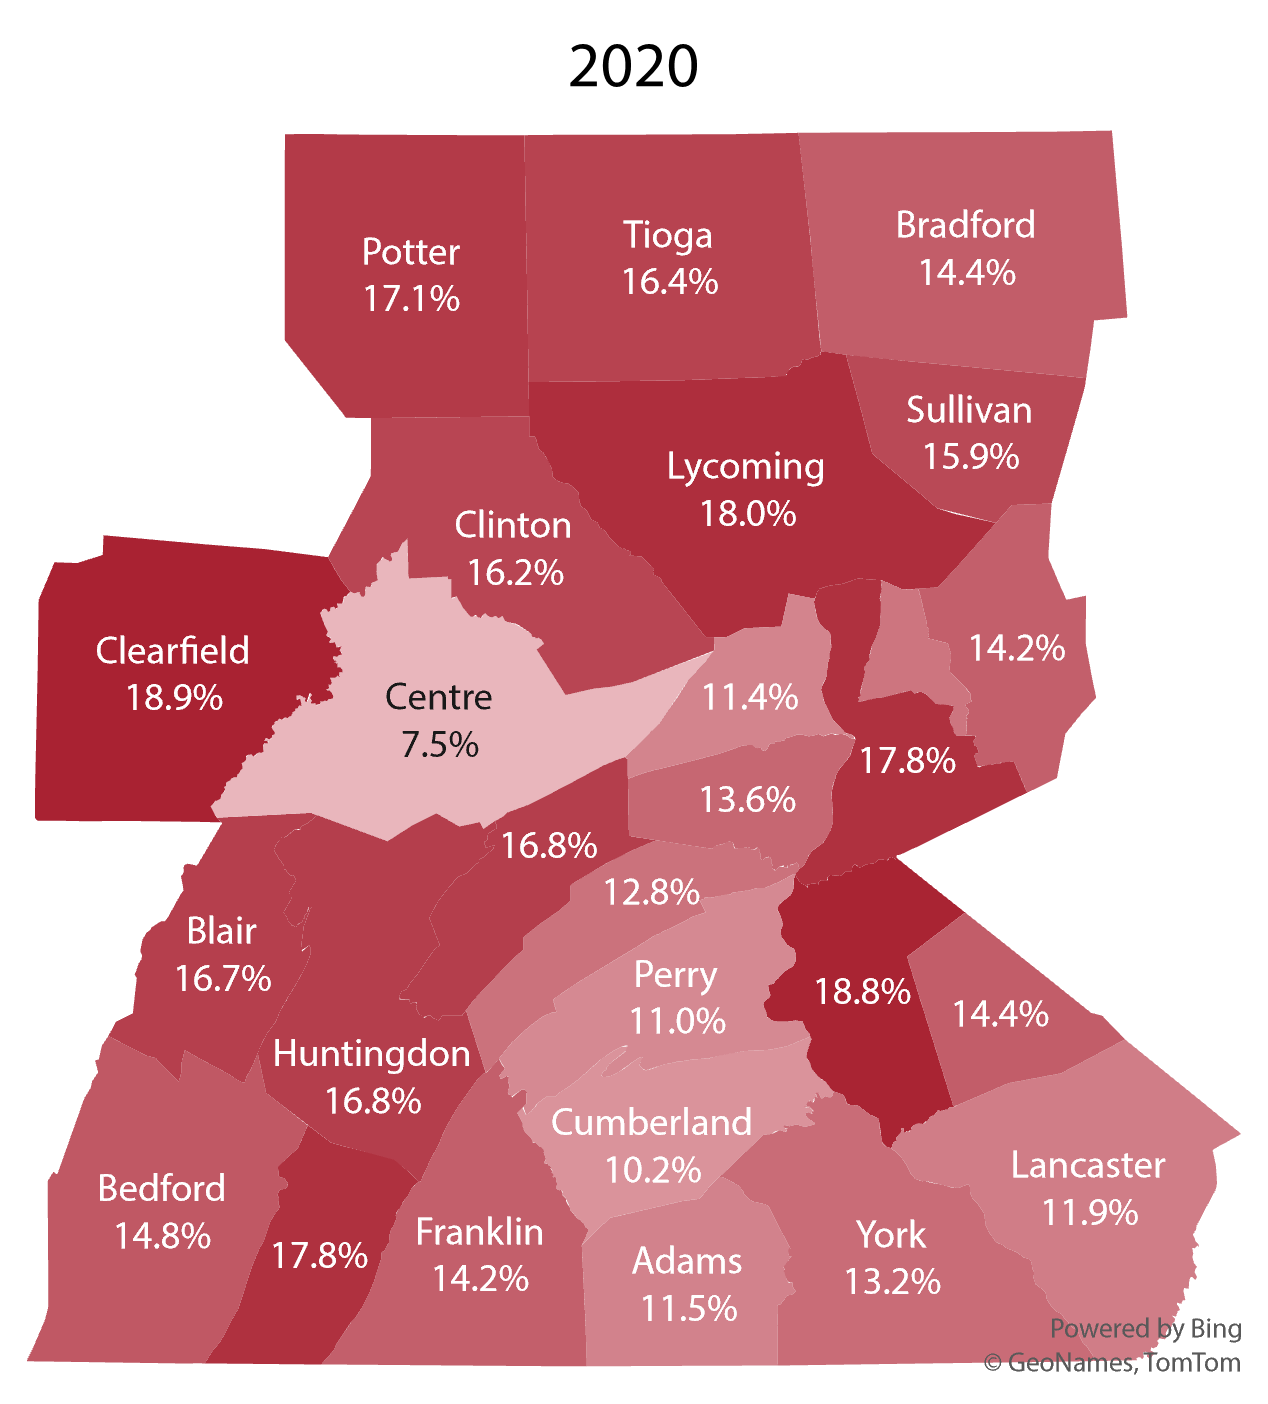
Child food insecurity dropped by 25% in CPFB counties in 2021 and the number of food insecure children in CPFB counties dropped in 2021, from 89,310 to 67,180. This drop was largely due to the impact of the expanded Child Tax Credit. Across the CPFB’s service territory, the child food insecurity rate dropped from 13.9% to 10.3% between 2020 and 2021. In 2020, the child food insecurity rate was 60% higher than the 8.7% rate among adults. In 2021, it was only 29% higher than the 8.0% rate among adults.
The below maps show child food insecurity rates at the county level.
Child Food Insecurity Rate
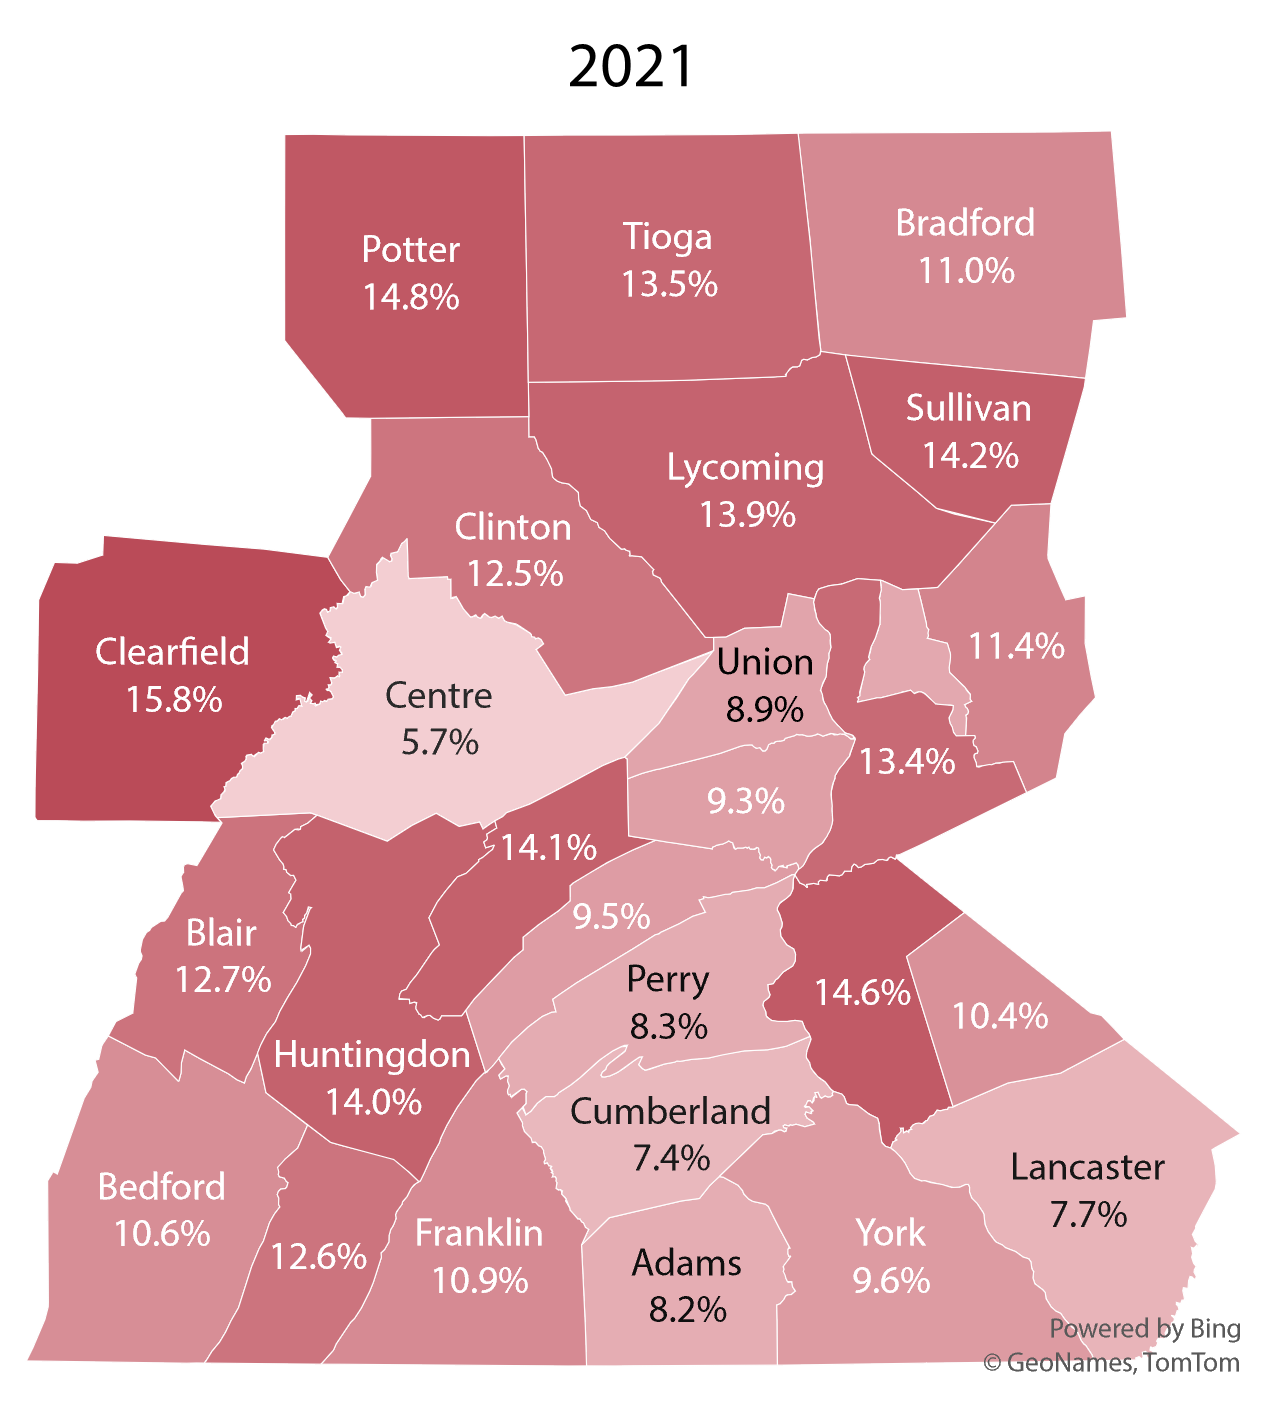

- In 2021, the Child Tax Credit went from a nonrefundable $2,000 per child in 2020 to a refundable $3,600 for each child under age 6 and $3,000 for each child ages 6 to 16. This expansion resulted in a drastic drop in child food insecurity and ensured that the poorest children benefited.
-
- According to the Center on Poverty & Social Policy at Columbia University, the monthly Child Tax Credit payments reduced food insufficiency among families with children by at least 20%.[2] However, the tax credit has since reverted to a smaller amount and the lowest income households are no longer eligible, so child food insecurity rates have likely increased again.
- The three highest child food insecurity rates were found in Clearfield, Potter, and Dauphin counties, which saw rates of 15.8%, 14.8%, and 14.6%, respectively. That equates to about 1 in 7 children facing food insecurity in those counties. In the previous year, the counties with the highest child food insecurity rates were equal to approximately 1 in 5 children facing food insecurity.
[2] The Differential Effects of Monthly & Lump-Sum Child Tax Credit Payments on Food & Housing Hardship.
Food insecurity rates of Hispanic and Black individuals were two and a half to three times that of white, non-Hispanic individuals. Among Black and Hispanic individuals in CPFB counties in 2021, the food insecurity rates were 21% and 18%, respectively, while among white, non-Hispanic individuals the rate was 7%.
Black and Hispanic individuals make up only 13.2% of the total population but are disparately impacted by food insecurity. Together, Black and Hispanic individuals account for over 28% of food insecure people.
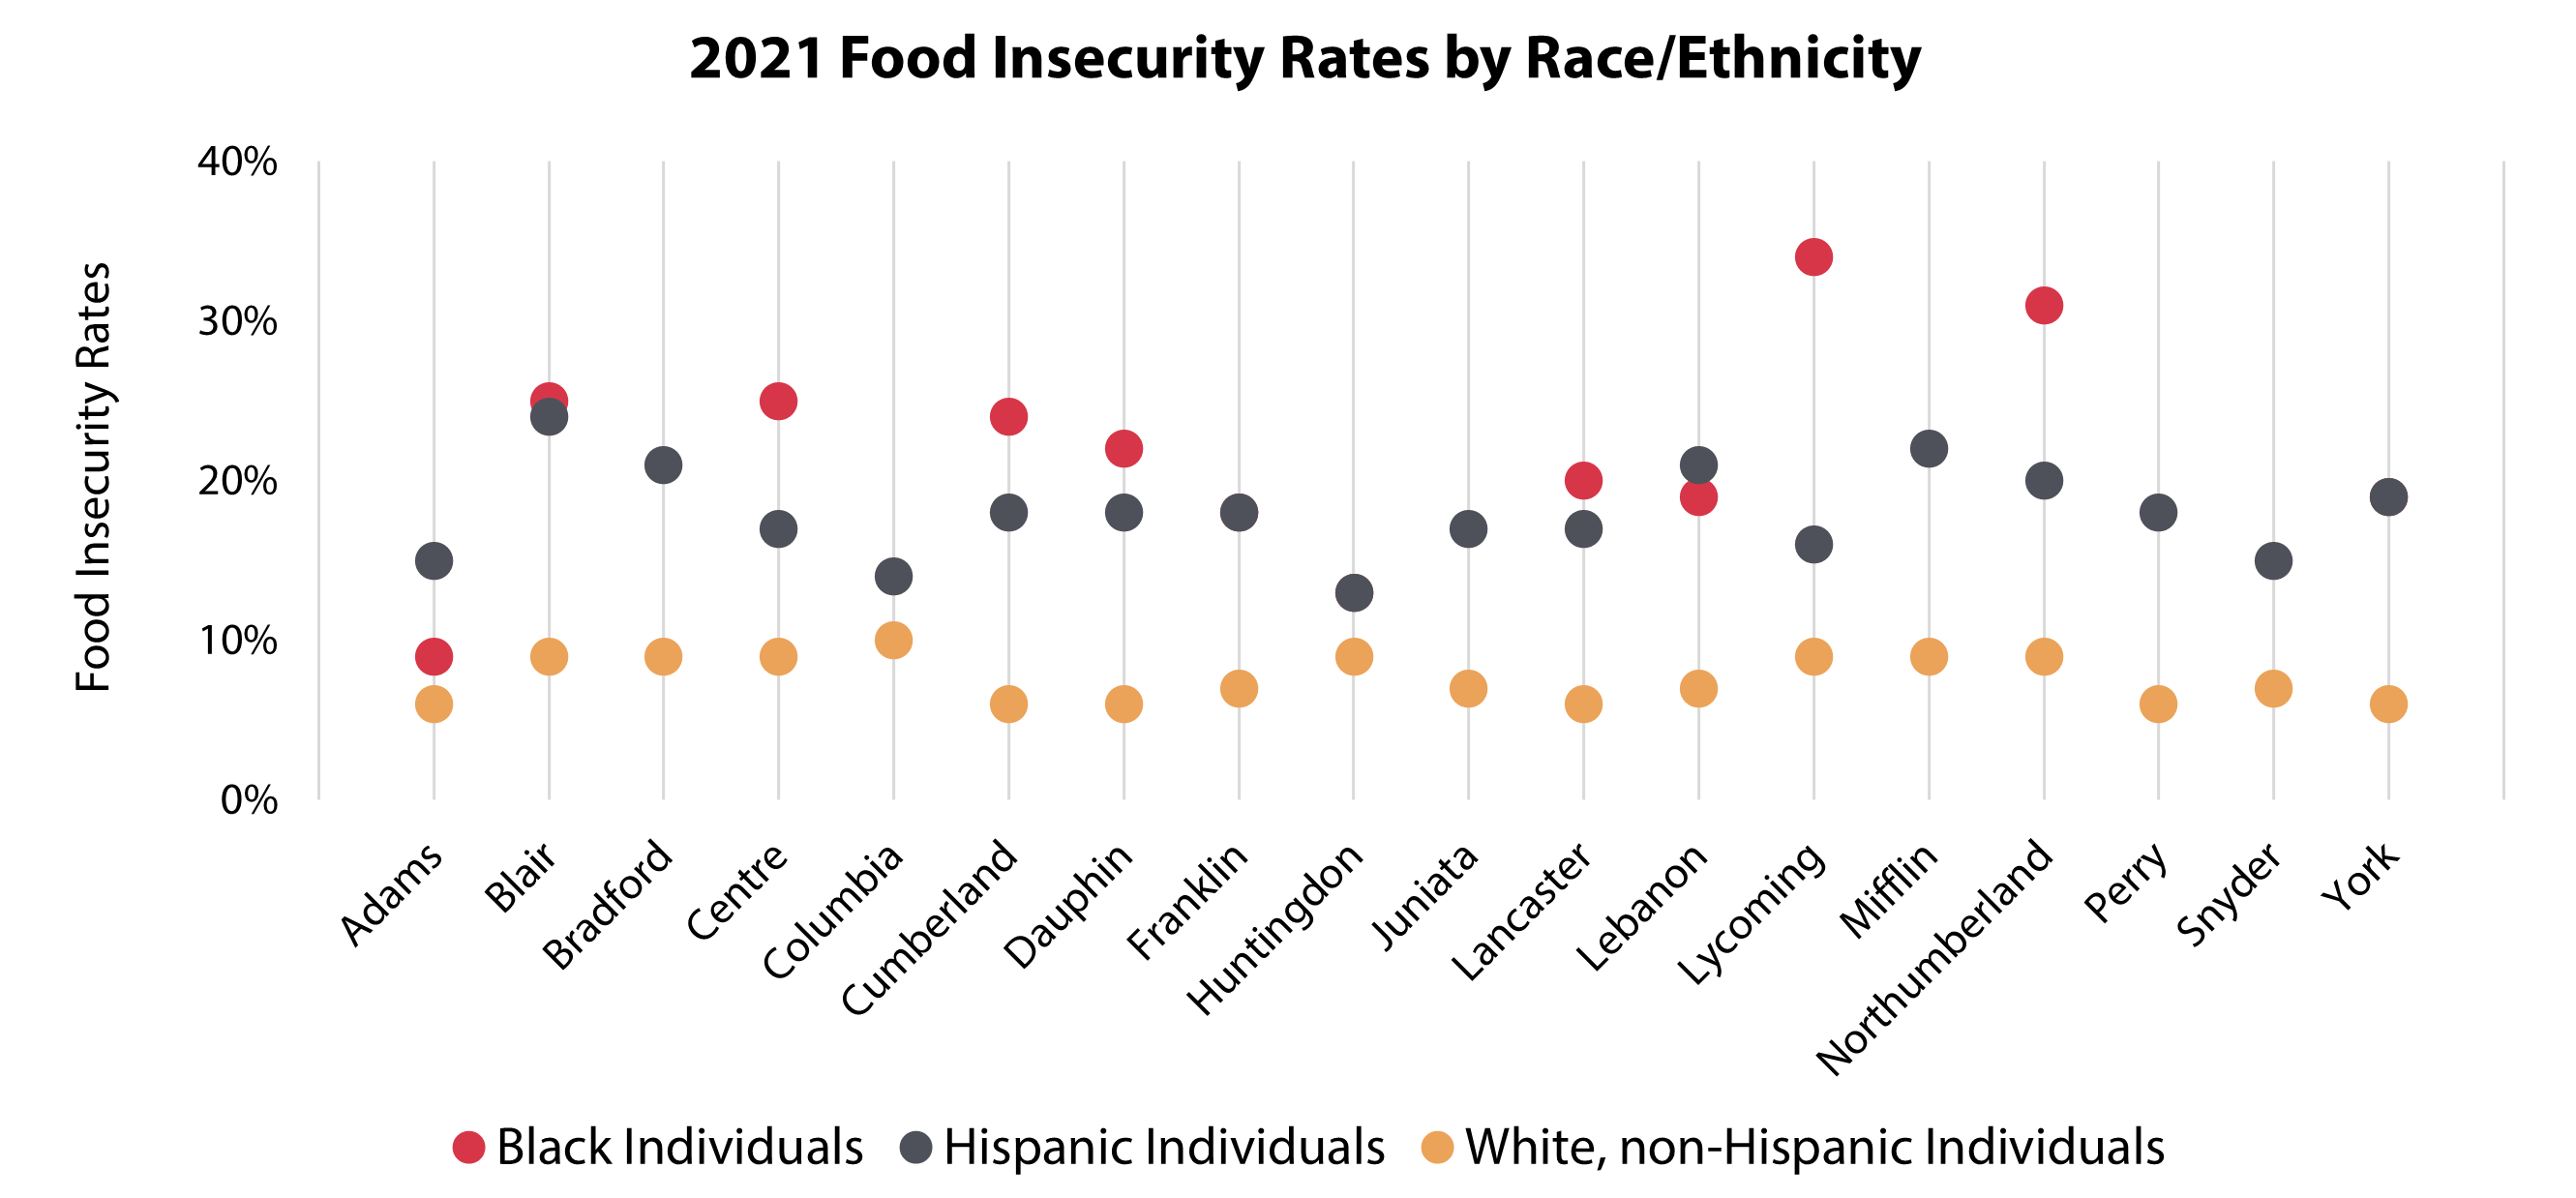
The chart displays the food insecurity rates among Black, Hispanic, and White, non-Hispanic individuals in Central Pennsylvania Food Bank Counties that have data available. Data used in this chart is from the 2023 Feeding America Map the Meal Gap model.
Only 12 of the 27 CPFB counties had sufficient data to determine food insecurity rates for Black individuals. Adams County had the lowest rate of food insecurity among Black individuals at 9%, while Lycoming County had the highest at 34%. These rates are nearly 1.5 and 4 times higher than white households in Adams and Lycoming County, respectively.
There are 18 counties for which Hispanic food insecurity rates could be calculated. In 2021, Huntingdon County had the lowest rate of food insecurity among Hispanic individuals at 13%, while Blair had the highest at 24%. These rates are nearly 1.5 and 3 times more than white households in these counties, respectively.
In 2020, Union County had the highest rate of food insecurity among Hispanic individuals at 34%. However, food insecurity among Hispanic individuals in Union County was not estimated in 2021.
Methods and Data: This report is an analysis of the change in the food insecurity situation between calendar year 2020 and 2021 using the 2023 Feeding America Map the Meal Gap model, which estimates food insecurity based on its relationship to multiple demographic and socioeconomic factors such as poverty, unemployment, median income, homeownership rates, and disability status.
