
By By Morgan Flood, Policy Research Specialist
There are a number of misconceptions about the charitable food system, including that food pantries are primarily or exclusively intended to be a resource for the unemployed, or that most visitors at food pantries are out of work. New research and data initiatives are showing that this is not the case, and that even neighbors who are working full time face difficulties in putting food on the table without assistance from the charitable food system. In this policy blog, CPFB Impact and Policy Research considers the variety of income sources upon which central Pennsylvanian food pantry visitors rely as well as poverty rates by income source among pantry visitors.

As shown in the chart at left, the most common source of income for food pantry visitors in central Pennsylvania is Social Security or pension; about one in three survey respondents (32.5%) reported it as their main income. Next most common was full–time work, at just over a quarter of survey respondents (26.9%), followed by Disability or SSI at about a fifth of respondents (18.9%).
Altogether, these three sources account for the incomes of nearly four in five pantry visitors (78.3%); when part time work or gig work (9.3%) are included, the share of pantry visitors who are either working, disabled, or retired rises to nearly nine in ten (87.6%). Only one in a hundred respondents (1.1%) reported unemployment insurance as their primary source of income, while one in nine (11.3%) relied on another source of income, including but not limited to Temporary Assistance to Needy Families (TANF, formerly known as welfare), child support, or other sources.
It is important to note that income source is related to household composition; that is, households receiving Social Security or pension are typically seniors, while younger households are more likely to be working. Two in five surveyed pantry visitor households (39.9%) were households with children, and the plurality (46.9%) of these households reported full-time work as their main source of income. Just over a third of survey respondents (35.8%) were senior-only households; most (64.2%) relied upon Social Security or a pension. One in five (21.8%) pantry visitor households was composed of working-age adults without children; these households tended to either be working full time (27.7%) or receiving Disability or SSI (26.3%). A small number of survey respondents had other household compositions not listed (2.8%); these households were most likely to report having “other” sources of income (42.2%).
As shown in the chart at left, the most common source of income for food pantry visitors in central Pennsylvania is Social Security or pension; about one in three survey respondents (32.5%) reported it as their main income. Next most common was full–time work, at just over a quarter of survey respondents (26.9%), followed by Disability or SSI at about a fifth of respondents (18.9%).
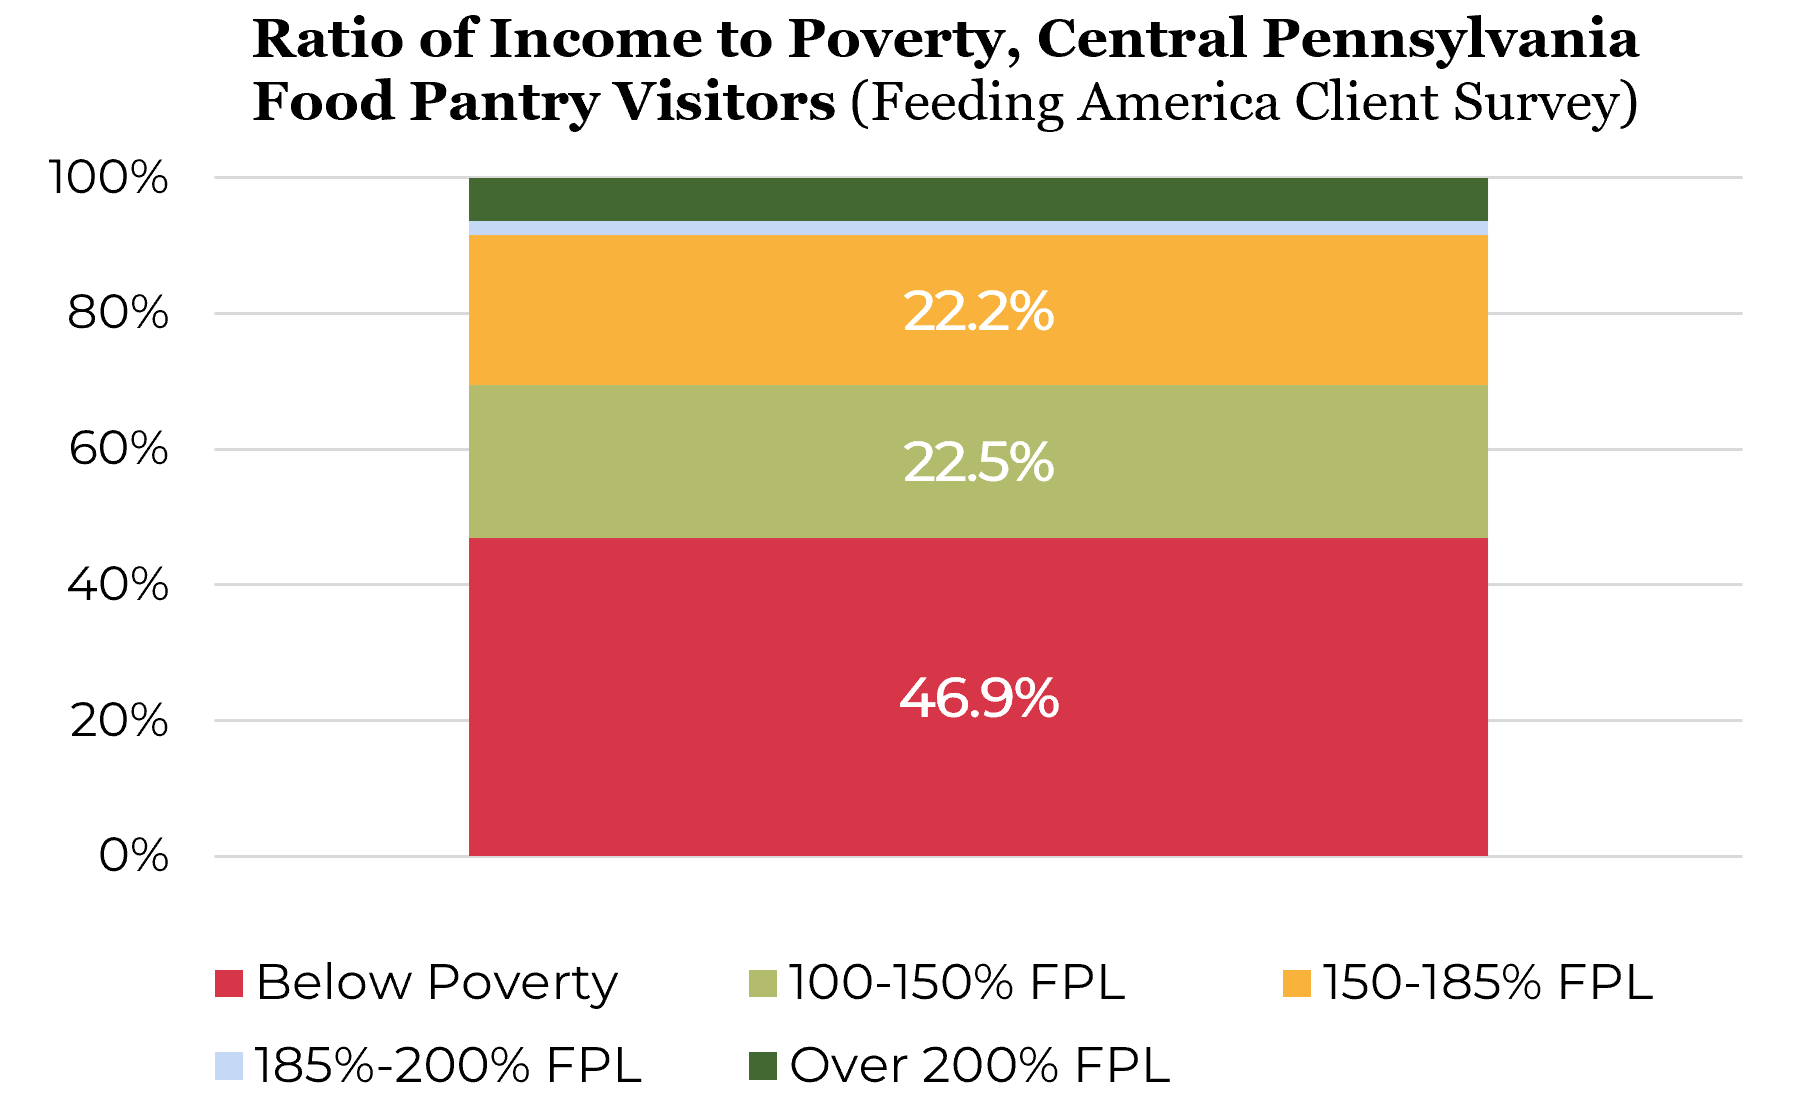
Regardless of income source, poverty rates are consistently high among central Pennsylvania’s food pantry visitors. Nearly half (46.9%) of all surveyed pantry visitors lived in poverty based on their reported income and household size; one in five (22.5%) fell between 100% and 150% of the federal poverty line (FPL), and another one in five (22.2%) had incomes between 150% and 185% FPL.

On the other hand, households reporting disability or SSI (53.1%), part time or gig work (69.9%), unemployment insurance (78.3%), or other sources not listed (87.0%) were all substantially more likely to live in poverty than the average pantry user household. Although households working full time were slightly less likely to live in poverty than the average pantry visitor household, the fact that two of every five full-time working households that visit food pantries live in poverty (42.4%) is still highly concerning, especially because poverty is the strongest determinant of food insecurity.
Overall, this data shows that pantry visitors who are able to work are doing so. Additionally, it indicates that all pantry users are consistently hard-pressed to get by. Though precariously or part-time employed, unemployed, and disabled individuals are especially vulnerable, many full-time workers still struggle. This indicates that, on the whole, food pantry visitors are facing affordability challenges, as their incomes simply are not enough to allow them to pay for their basic needs.
There are a wide variety of policy and program changes that could help support the poverty and food security status of pantry visitors. Potential topics of interest include policies that promote family-sustaining wages and economic stability like an increase in the minimum wage; increases to the adequacy of SSI and Disability benefits; the expansion of tax-exempt savings accounts (ABLE accounts) that do not count against SSI asset limits; and changes to policies that discourage individuals who receive Disability from working beyond a certain income threshold. Beyond this, work to reduce administrative burdens and “time taxes” across the entire social safety net could alleviate hardship by ensuring that all eligible individuals have meaningful access to federal anti-poverty resources, such as SNAP and Medicaid, that can help them make ends meet.
Data Sources and Methods:
The key data collection tool used as part of IPR’s flagship Community Hunger Mapping research initiative is the Feeding America Client Survey (FACS), a survey conducted at food pantries that asks visitors about their experiences with charitable food, demographics, and personal circumstances, including their food security status and housing situation. Since surveying began in fall 2022, more than 3,700 households visiting more than 70 agencies across sixteen counties have responded to the survey. Adams, Bradford, Centre, Clinton, Cumberland, Dauphin, Franklin, Lancaster, Lebanon, Lycoming, Northumberland, Potter, Snyder, Sullivan, Tioga, and Union counties are the sixteen represented counties; they are geographically diverse and together make up more than two thirds (68.7%) of the total population of CPFB’s service area, so the aggregate data can be assumed to be generally representative of food pantry visitors across central Pennsylvania. For the purposes of this analysis, “don’t know,” and “prefer not to answer” responses have been excluded, bringing the total number of households represented in the dataset to 3,314.